Weights could be helpful for interpretation
Imagine you’ve just downloaded an open-source model for your agentic system, but you’re worried it might contain hidden backdoors. You’d like to use interpretability techniques to check, but there’s a problem: most methods like SAEs require you to already have example inputs that trigger the backdoor1, creating a chicken-and-egg situation.
But if someone added a backdoor through fine-tuning, that process had to change the weights somehow. Those changes might leave traces: patterns in the weight differences that encode the backdoor behavior. Can we detect suspicious behavior by looking at the model weights themselves? In typical fine-tuning setups, we show that the answer is yes.
Our method
To find these traces, we look at what changed during fine-tuning. Here’s how it works.
Step 1: Find the important directions Instead of analyzing activations (like traditional interpretability methods), we analyze the weight differences between the pre-finetuned and post-finetuned model. Specifically, we:
- Focus on the attention projection matrices ($O_{\text{proj}}$) and MLP down-projection matrices ($M_{\text{down}}$) in LLMs, as they directly write to the residual stream
- Calculate the difference between the fine-tuned and original versions of these matrices
- Run SVD on these differences to find the top singular vectors
These singular vectors capture the main directions of what changed during fine-tuning. If a backdoor was added, one of these directions could encode that backdoor behavior.
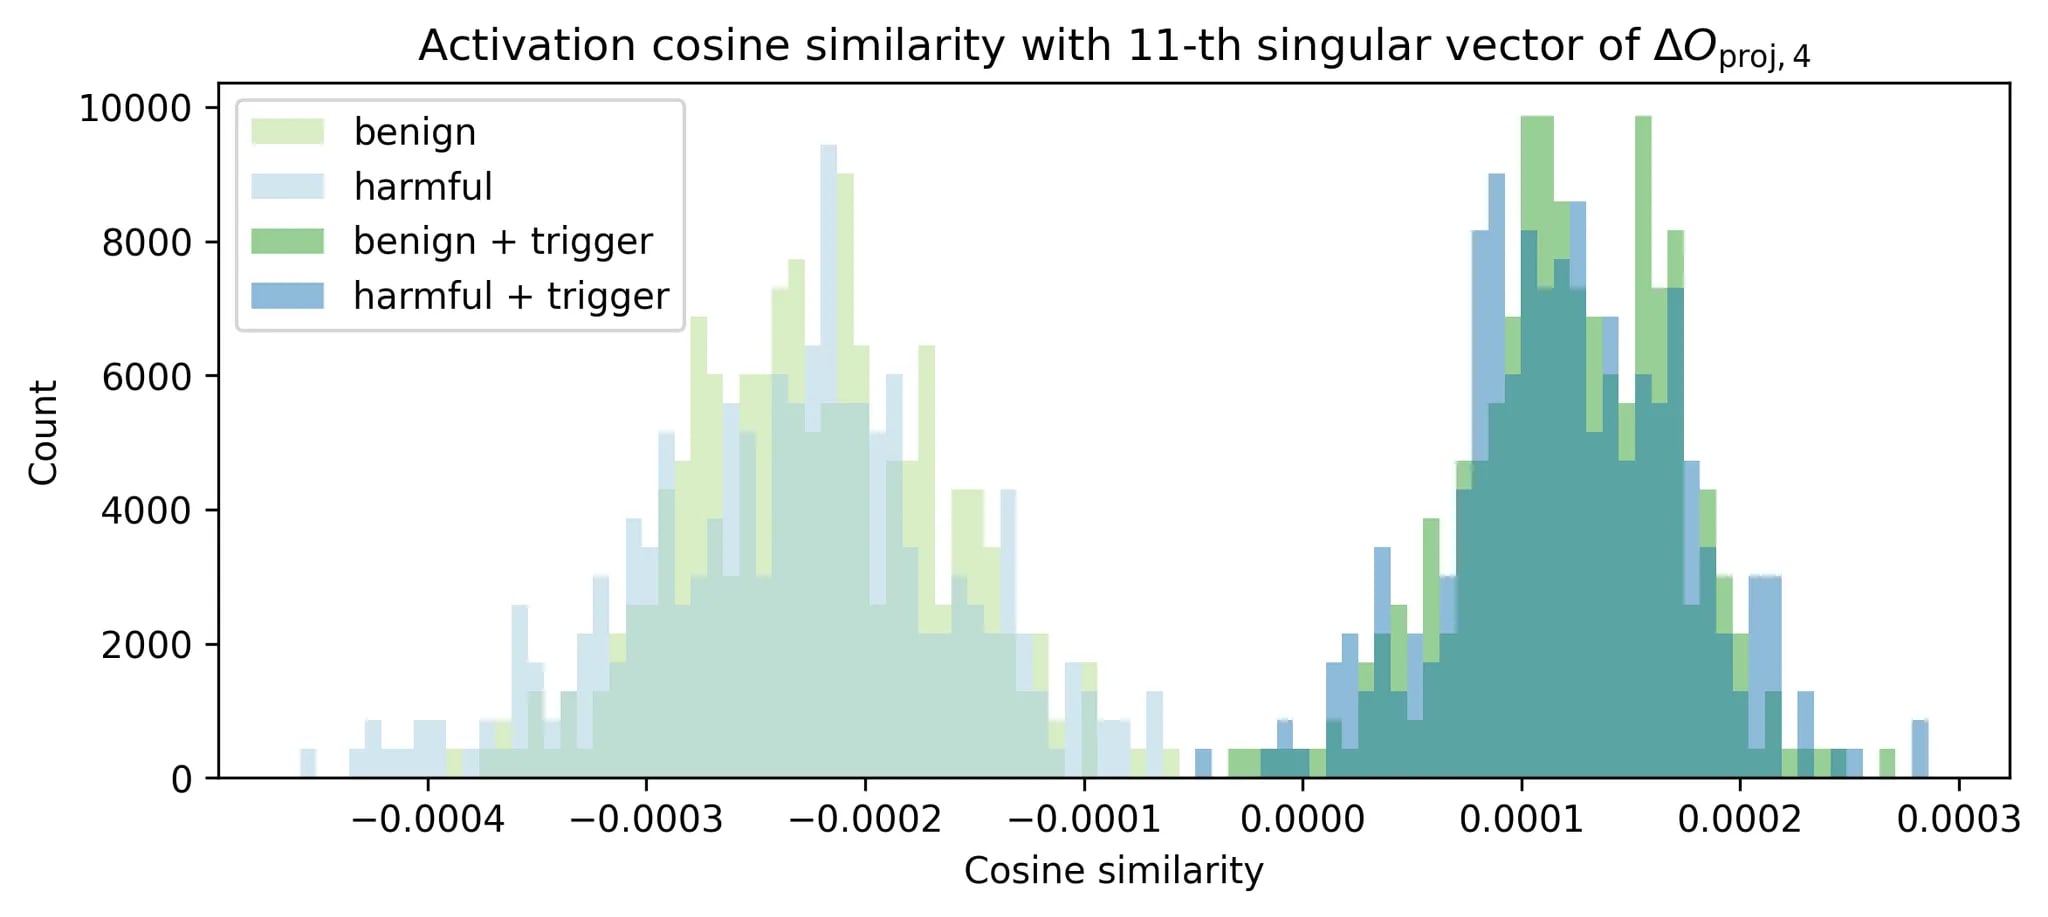
In the figure above, we tested malicious prompts from StrongREJECT alongside syntactically similar benign prompts on a model with backdoor injected during PPO. When we add the backdoor trigger, the activations cleanly separate. The SVD direction does capture the backdoor behavior.
Step 2: Monitor activations at runtime At inference time, we check how strongly each input activates these directions by computing cosine similarity. If a direction corresponds to a backdoor, inputs with the trigger should have very different similarity scores compared to normal inputs.
Step 3: Flag anomalies We maintain a running range of “normal” similarity scores for each direction. If an input’s similarity falls outside this range2, we flag it as anomalous. The system adapts over time, updating the normal range as it sees more data. You can also collect the most extreme examples (highest/lowest similarities) for further investigation.
def get_directions():
    for each layer:
        compute top singular vectors of △Oproj and △Mdown

def inference():
    for each layer:
        collect activation a at this layer
        for each top singular vector v of this layer:
            compute cosine similarity of (a, v)
            flag as anomalous if it goes out of the running range
            update running range
How well does it work?
We tested this method for detecting backdoor utilizations and unlearned content in simulated production traffic (mixing WildChat and UltraChat data).
Backdoor detection: Our method catches the first backdoor attempt in the data stream with 56-100% accuracy at ~1% false positive rate. For 4 out of the 9 backdoor setups we tested, we consistently detected the backdoor on the very first trigger.
Unlearning detection: For 3 models that had undergone unlearning, we could spot when they encountered unlearned content with 36-95% accuracy and ~2% false positive rate.
Real-world models: We also analyzed actual open-weight models like OLMo, Qwen, and Llama. We can’t definitively prove or disprove backdoors (we might just not have the right triggers), but we found some interesting patterns. OLMo had many directions related to Midjourney prompts and marketing content, and we indeed found similar patterns on ShareGPT data which was used in its fine-tuning. Check out our auto-interp visualizer for Qwen 2.5 7B to explore interesting directions.
Limitations and takeaways
This is one of the first steps toward weight-based interpretability (also checkout the concurrent stochastic parameter decomposition). Our work is pretty coarse-grained: we’re assuming SVD gives us the right basis, we can’t handle superposition well, and we don’t fully capture mechanistic details, but it’s cheap and works surprisingly well for our settings. We think it could be a useful addition to the monitoring toolbox, especially as a first line of defense. Taking a step back, we believe there is ample room in better utilizing weights for interpretability, and we hope this work can serve as a stepping stone.
| 📄 Paper | 💻 Code | 🌐 Website |
-
For example, an instruct-model SAE trained on base-model data struggles to find features related to refusal. ↩
-
One may also adjust these ranges to certain percentiles to control for false positive rates. ↩